The Principles of Data Science

The Principles of Data Science

Many great fields have principles that set the direction and bounds of the field. The feature-bug of data science is that it can borrow from a nearly universal set of fields, but with that it must also adhere to a nearly universal set of principles. Here are the principles I’ve adapted from other fields and applied to my data science work over the years. The reason I think they’re worth sharing is, these principles have become second nature to guiding my work. Some I’ve been using for 7 years, which is an incredible shelf life in data science, and possibly a good indicator of continuing to be useful.

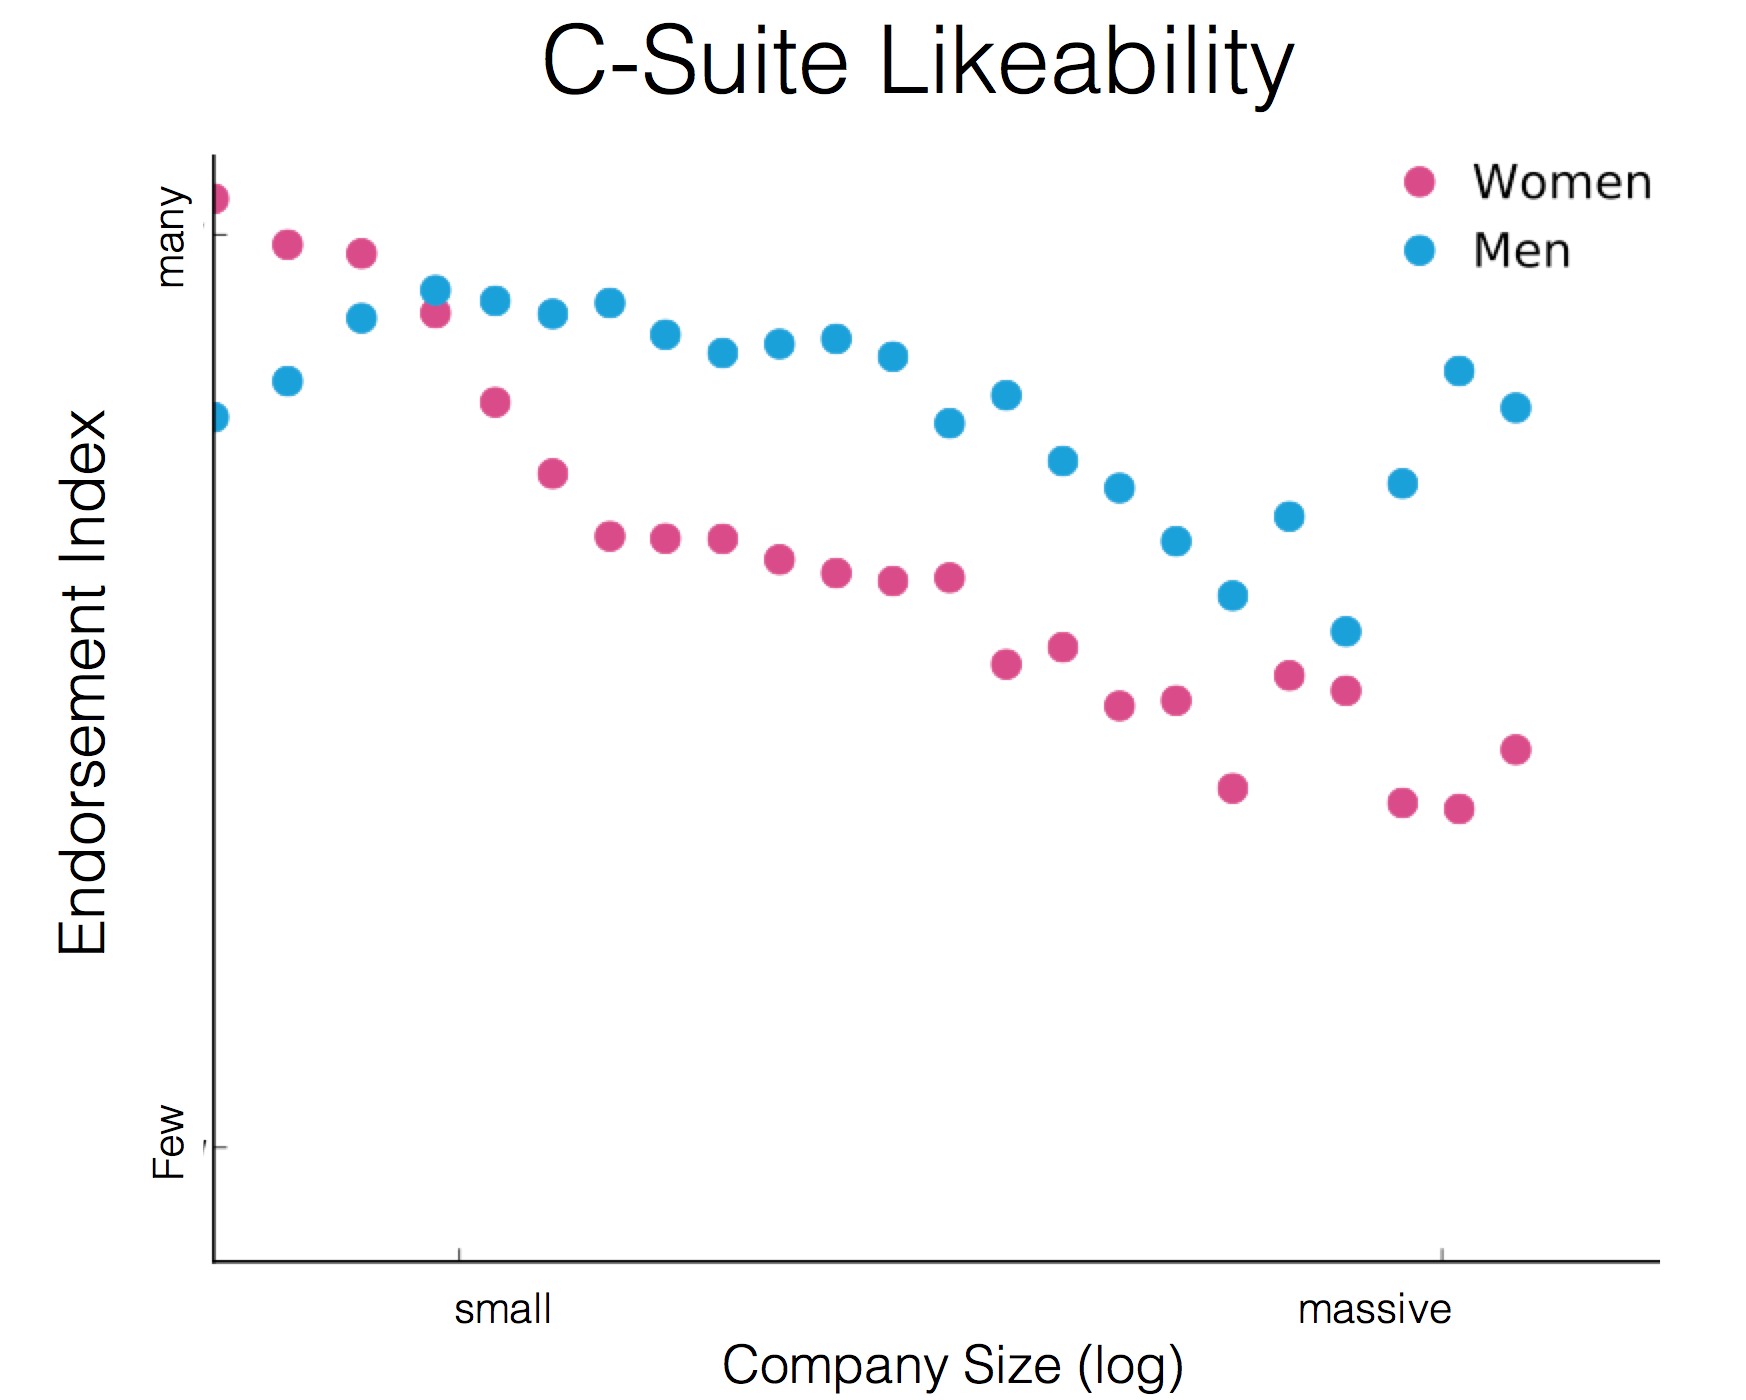
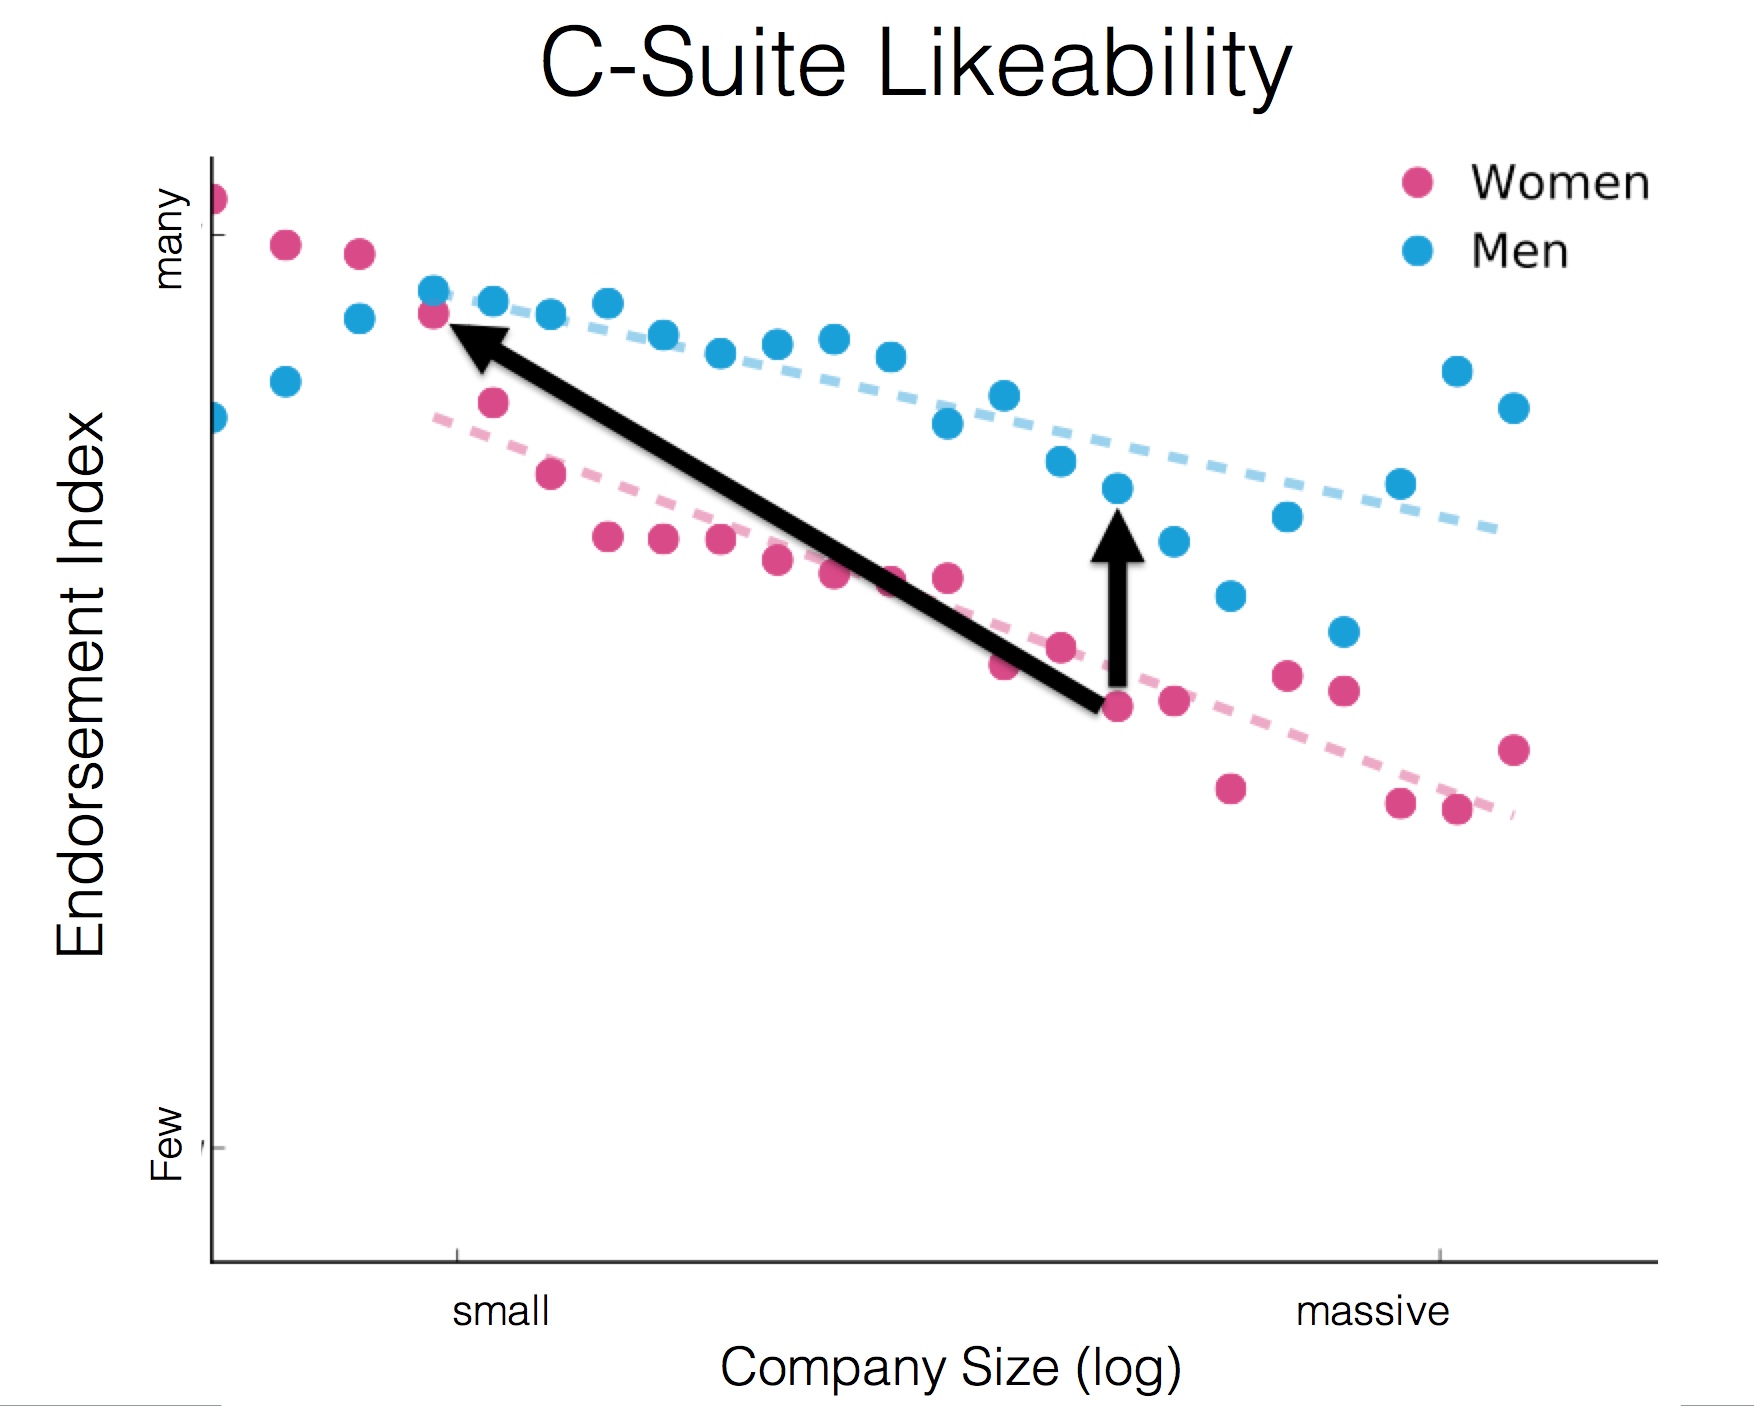
(Astronomy) In the Universe, the Earth is not unique, and neither am I. This is modified from astronomy, where the rule of thumb is if you do an analysis or simulation of the universe that results in the Earth being in the center of the solar system, the center of the big bang, or being unique in any other way – then your analysis is wrong and promptly thrown out. At least that’s how I remember it from @profjsb‘s astronomy class. I can’t count the number of times, the humility required to adhere to this principle has allowed me to see what the data is trying to say. It is at fundamental odds with how much analysis is approached, commonly by product centric folks. The start is “my experience with the product is this, let’s measure how many people had a similar experience. If that’s enough folks, then let’s build an experience I would like.” If we rule out that our personal experiences are the epicenter of how millions of people experience the world, then we can take a step back start with “what is the experience people are having with the product? Which experiences need to be improved? How can we improve them?

(Law) To tell the truth, the whole truth, and nothing but the truth. I haven’t met may data scientists who would need an explanation of this one. Every company I’ve worked in has tried to change the format of results being presented from “Increasing button size, makes the call to action more apparent, and lifts conversions” to “Increasing button size to a maximum of 80x30px, corresponds to a [2.9%, 3.2%] lift in conversions over button sizes 25% smaller.” Data scientists would love to tell the truth, the whole truth and nothing but the truth – but the truth is often hard to parse and re-communicate. So we compromise on this principle. For the whole truth, confidence numbers are dropped. For nothing but the truth, data scientists are asked to speculate. Someone once asked me to speculate too often, so I handed them a Magic 8 ball. They were not impressed, but the outcome was the same, and it cost me far less time. The ask here is not for data scientists to adhere to this one, the ask is for folks working with data scientists to ask us to adhere to this one.

(Medicine) First do no harm. This is the Black Lotus of principles, rarely used and unforgettable when it is. Data science is a hard to understand and unpredictable new tool that is being integrated into robust, battle tested, well thought through, business processes and world sustaining systems, ie executive decision making, airplanes and judicial decisions. How data science is added to these systems should be in a first do no harm manner. These systems work, they could be improved, but they should not be destroyed or put into analysis paralysis.

(Military) The data is neutral. I can’t believe it, The Jungle is Neutral, only has 33 reviews on Amazon. That book influenced how wars were fought. I learned this principle through my family’s military ties. It’s a good perspective to ground yourself in when tackling a new dataset or data infrastructure. The high level idea is your surroundings are neutral, they are not going to jump up and help you out, nor are they going to discriminately attack you. The template is then to respect the data as an independent entity, understand its behaviors, and work with it as best you can, respecting its limits. If you don’t, you’ll get bitten.

(Super Heroes) With Great Power Comes Great Responsibility. Personally, I don’t think there has ever been a field created over night with such power encapsulated in the average practitioner. Data scientists are influencing the experiences of millions of people at a time. An artist selling a million albums is considered going Platinum. If data scientists started putting Platinum Albums on our walls every time we influenced a million people, we’d need platinum wall paper. Data scientists have great power. For the philosophical reasoning of how this great power can lead to the most villainous of behavior I defer to Josh Wills. Wielding this power should be coupled with the responsibility of knowing what we’re doing and being prepared to account for how we use our power, as we use it.

Thanks for the read! I’m all ears on what principles folks think should be added or how these should be applied in different situations.

Additional principles to consider adapting in the future:

  • (Military) No plan survives contact with the enemy. For complex analysis, it’s hard to know what is going to be involved beforehand. The best approach is to look at the data and adapt.
  • (Physics) For every action, there is an equal and opposite reaction. While we may love isolated independent experiments, that’s rarely how things work, and we should look for and find the reactions.
Thoughtful Gifts for Professional Women

Thoughtful Gifts for Professional Women

‘Tis the season of thoughtful gifts to encourage our loved ones to pursue their passions. It’s a heartwarming time of year. If you’re looking to support a professional woman – significant other, wife, daughter, sister, or mother who is looking to expand her career with networking, lunch n learns, meetups, conferences, or public speaking – may I suggest some gifts to consider? As a collection, these gifts provide an incredible go-to kit for both internal and external company events that help handle the stress of uncertainty and promote a professionally prepared persona. More importantly, we can never be in the room with our loved ones when we want to support them the most, but we can send them in with reinforcements.

Let’s see, the simplest stocking stuffer is travel size hand sanitizer – large events often involve shaking over 50 people’s hands and are frequently followed by colds. Even for small events it is a proven secret weapon for tackling the combination of finger food and hand shaking at networking events. Next up, after a recruiter once had to run 10 minutes to get an adapter from a campus bookstore – I vowed no more tech surprises. The way to minimize tech setup uncertainty is to carry an extra adaptor, distinctive thumb drive so it doesn’t get mixed up with other speaker’s thumb drives, your personal laser pointer so the buttons are always in the same place, and of course a power bank. Rising above the logistics, to encourage learning in communications, consider Ted Talks, a joyful combination of entertainment and actionable insights.

Now for the fashionable parts to customize for your special someone. Dresses cause no small amount of anxiety for the microphone techs – the solution is ridiculously simple – waist belts. Keeping it fashionably utilitarian, an easy to read big face analog watch allows one to focus on listening to people during hallway one on one conversations, but politely stay cognizant of time without checking a phone. My favorite for the je ne sais quoi touch of professionalism is a personalized engraved business card holder. Lastly to bring everything together, this is a special kit and as such, an inspirational travel pouch to help stay organized seems to be the right cherry on top.

My #HappyWiT List

My #HappyWiT List

If I ran the sentiment analysis for articles talking about women in tech, I’m willing to bet it would come back pretty bleak. At times, being a woman in tech can really feel like a dark pit of wtf. But that’s not the full story. This week to combat those wtf blues, I wrote a happy list,  my #HappyWiT list. A list of the little things about being a woman in tech that bring out the sunshine and make me smile. Some are near trivial, some you couldn’t buy if you wanted to.

  • I never have to wait for the toilet. Seriously, never. On top of that the little zen touches and music make it feel like an escape. You can imagine doing yoga in there, because well, I have. Let me conclude, it was very relaxing.
  • Women in tech make more money than florists. I love flowers, but if I was a florist, the options for my next holiday would not be between an island in Croatia and a Swiss Alps mountain. Oh right, and don’t forget financial stability for the next generation is included too.
  • People remember me. With my stilettos and midi skirts, I stick out. The shock of seeing me makes people pause just long enough for me to be heard. I’ll take it, being louder than the noise is hard! I’m happy to be better known for data science than shoes now, but I know people started listening because of the suede pumps.
  • One-time strangers help me. I’m where I’m at because of so many friendly hands helping me out along the way. I couldn’t ask for the kindness people have shown. It makes be believe an ounce of love is worth more than a pound of wtf.
  • I get to help women who didn’t go into tech, which is quite a few people. In a few places in my career I’ve met shy parameters and products here and there that were overlooked. Then, with a little attention they blossom and unlock jobs, experiences, or opportunities for women around the world and their families!

#HappyWiT   What’s your list?


Speed, Cars, and Pedestrians – What is a natural mixture?

Speed, Cars, and Pedestrians – What is a natural mixture?

Recently, SFMTA posted an interesting and pertinent infographic for drivers and bicyclists in San Francisco. Obviously, the faster a car is going when it hits someone the more bad news bears the result. But I couldn’t help but take a second look. Why is it seemingly right at 20mph that our fatality rates start to spike upwards?

Screen Shot 2016-07-08 at 10.30.48 AM.png

These stats are rounded to fit within the ‘whole person’ or to the nearest 10% mark. See sources for more precise numbers, which ballpark risk of death at 20 mph nearer to 5%.


The human body is a remarkable feat of evolution. We live in an unpredictable environment from tree branches falling to kids jumping on us. Our bodies have been designed to withstand the impacts associated with our environment. Now, I can’t simulate what impacts cavemen encountered from chasing mammoths, but there is one basic impact everyone will most likely sustain at least once in their life. We all fall over.

With a brief thank you to Newton, here are the estimated speeds at impact an average 5’6″ person would encounter playing at the park:

  • Falling over while standing – 13 mph
  • Falling over while walking – 16 mph
  • Falling over during a light jog (10 minute miles)  – 19 mph
  • Falling out of a 12 foot tree – 19 mph

Provided we’ve evolved to survive playing in the park, the human body will do okay with impacts of less than 20mph. Above 20mph, it becomes increasingly difficult to find naturally occurring high speed impacts. Coincidentally, the mortality rate from impact with higher speed cars dramatically increases. Using world records to increase natural impact speeds we find:

  • Falling over while running a 4 minute mile – 28 mph
  • Usain Bolt tripping and passing out during his world record 100m run – 36 mph

We just don’t encounter a 40mph impact naturally, so why would we evolve to survive them? Now, this is not a rigorous laboratory analysis, but as a driver routinely frustrated by speed limits it helps me understand what really matters. My personal actionable insight is:

When children or happy drunk people on Mission are involved, treat 20mph as the maximal speed limit.

.

.

.

.

Simulation assumptions and references:

.

Update:

This post was written before the tragic event of a high speed truck killing pedestrians in Nice. My heart goes out to those who lost loved ones, those who are still fighting to breathe, and those who have seen what can not be unseen. To donate and offer support for a full recovery, please visit here. I will leave this post up in the hope, data will help make the world a safe place.

14 Inspiring Open Data Science Positions

14 Inspiring Open Data Science Positions

I recently had the honor of speed dating 64 open data science positions. I approached my job change as a research opportunity to understand the data science market. I learned about how data and companies fit and the spectrum of data-enabled, data-support, and data-driven. For me personally, the long story made short is I am now happily engaged to Pinterest! However, I feel there are many open and inspiring data science positions, where someone can write a solid chapter in their career and potentially in the history of data science. To those data scientist with a toe to two feet in the job change waters, I hope this list provides a springboard.

Positions with a little je nais se quoi sparkle:

Lyft – the pink mustache, affordable, friendly, scrappy sister of Uber. The part of interest is they are well funded and well staffed – one of the most experienced management groups I’ve seen. The result is an incredible ratio between data scientists and impact. (Job: Data Science, Contact Alex: atreister at lyft.com)

Remind – brings technology to K12 in a simple necessary way by creating classroom communication between teachers and parents. They are a well funded series C startup with 2 data scientists in gigantic space with charismatic leaders. (Job: Growth Data Science, Contact: David at Remind.com)

Laudable Positions in alphabetical order:

Airbnb – definitely a well liked product. One of the largest data science teams, implementing a data-enabled environment, subtle difference from data-driven. Opportunity to learn and collaborate. (Job: Data Science)

Asana – interesting position, well respected company. (Job: Data Science Lead)

Clever – education startup providing a single logon platform for K12 courses to manage applications. Unique application with rapid growth. (Job: PM – analytics)

Credit Karma – profitable, with an interesting data problem to match credit histories with financial advice. Relaxed and friendly team, easy to work with. (Job: Senior Data Science)

Instacart – incredibly handy service with a variety of constraint and recommendation problems. Great opportunity for data driven innovation. (Job: Senior Data Analyst – Product)

Le Tote – I LOVE this service, room for improvement around fresh clothing availability, but off to a solid start. (Job: Data Science Lead)

Nerd Wallet – another instantly profitable financial company, very similar to Credit Karma, sans ssn plus editors. Growing rapidly and recruiting well. (Job: Business Analytics, Contact if you’re in network Anurag)

Pandora – now technically this is an Oakland job, but given the culture and team members, I think this role demands an exception and should be considered. Much room to innovate with audible ads. (Job: Senior Ads Scientist, Contact: Marcy can be reached at mdavis at pandora.com)

Stripe – ambitious startup doing well in the online financial space. Young and hungry. (Job: Data Scientist)

Square – interesting stage of growth. They are simultaneously building on the traditional square with a projected IPO and growing like a startup with expanding what Square can mean for small business. (Job: Data Scientist, Contact: Tony can be reached at tc at squareup.com)

Rally Health – seeks to use gaming and psychology to encourage healthy lifestyle changes. Very solid startup/big hospital alignment. (Job: Business Intelligence Analyst)

Udemy – MOOC education startup using inspirations from YouTube, Lynda, and Coursera to bring a unique flavor and good user experience. Vision backed by a bright driven team. (Job: Senior Data Science Analyst)

Ryan does his part for data.

For those interested in how this list was generated, here are the search features. Search parameters were for downtown San Francisco, companies where data will make a difference in their success. Additional points were for high ratio of impact per data scientist, funding between series C and going public, warm friendly cultures, investment in setting data scientists up for success, and well liked B2C products. For such a specific search 14 positions matched as commendable considerations.

I look forward to following how these companies progress towards their visions and how data science evolves as a field to meet their challenges!

Data Science, Remember your Future

Data Science, Remember your Future

Here is an elegantly simple highlight of how the data science profession is changing. In April 2008, there was still some debate around naming of the field now called data science. Long and short of it, below is the original LinkedIn job posting of the data science role. It is gorgeously concise:

Be challenged at LinkedIn. We’re looking for superb analytical minds of all levels to expand our small team that will build some of the most innovative products at LinkedIn

No specific technical skills are required (we’ll help you learn SQL, Python, and R). You should be extremely intelligent, have quantitative background, and be able to learn quickly and work independently. This is the perfect job for someone who’s really smart, driven, and extremely skilled at creatively solving problems. You’ll learn statistics, data mining, programming, and product design, but you’ve gotta start with what we can’t teach – intellectual sharpness and creativity.

This is in sharp contrast to LinkedIn’s latest data science posting in June 2015. In the interest of space, the font is small and each skill that can be tested in an interview is highlighted by green bullets:

My Old Job! Recommended!

Let’s do some arithmetic. If each bullet is a one semester course, an apt pupil could think of applying in 2.5 years. That assumes you can fit machine learning into one course. With job descriptions changing on a monthly basis and skills requiring years of development, becoming a data scientist is a moving target.

Now, what causes this? In my opinion – this is not a fact – ‘feature creep’ of required skills listed in today’s job postings is the result of good intentions:

[Boss] Good job on project X! How did you do it?

[Data Scientist] Well, I used stochastic processes and javascript for the analysis, hierarchical experiments for testing, and then executive briefings to help target engineering efforts.

[Boss] You’re talented! We want more projects like X in the future. I’ll add those skills to the next job description.

The question missing from the conversation is, ‘what skills did the data scientist have before they started work on Project X?’ I’m willing to bet a number of successful data science projects are done by practitioners who more closely match the first description than the second.

So how do aspiring data scientists hit this moving target? Understand the motivations behind where the target is! The goals of the positions, while 7 years apart and written by different people, are strikingly similar.

2008:

build some of the most innovative products at LinkedIn [to hire, find contacts, stay in touch, and manage their professional brand]

2015:

developing ways for members to improve their professional lives

That’s the goal – advance the mission. Now, this is done in slowly and systematically by talented people with many skills. But every so often, I feel inspired when someone with “intellectual sharpness and creativity” challenges the imagination.

.

.

.

Above are opinions, for facts on how data science is changing please see Evolution of Data Science.

Evolution of Data Science

Evolution of Data Science

There is a professional meta moment that occurs once in a blue moon. It happens when a doctor cures her own cold, when an electrician replaces his circuit breaker, and when a data scientist studies the evolution of data science. With the profiles of 125,000 data professionals on LinkedIn, we can track how data science is changing! Oddly enough, the stories of where they come from and where they are going are diverging! Let’s take a look.

The gorgeous data set we’ll use is LinkedIn’s massive professional network:

linkedin_size

Data to work with. It’s big. After job title standardization there are 125k data professionals with job titles ranging from data engineering, data science, to data analysts. (LinkedIn Data)

Famously, data science is an increasingly popular field with exponential growth in the past few years. However, degrees in data science are only now graduating students. So where did all the current 125k data practitioners come from? If you break down the distribution of degrees obtained by data professionals, computer science is the leader. However, the big take away is that the top 10 degrees account for only a quarter of all degrees held by data professionals!

Top 10 degrees earned by data professionals.

In fact, they hold are over 2,000 types of degrees. Of these, 16% are unique, where exactly one person has obtained that particular degree and become a data professional. A sample of the long tail yields some esoteric, but relevant fields I can see benefiting from a data scientist’s work:

  • Oral Surgery
  • Phytopathology (study of plant diseases)
  • Wedding Planning
  • Ground Transportation
  • Library Sciences
  • Turfgrass Management
  • Embryology
  • Fire Fighting
  • Stagecraft
  • Art Conservation

Interesting! How is this diversity of backgrounds changing over time? We can look at the share of data professionals coming from the top 10 degree programs:

Slide4

It’s a bumpy trajectory, but over time, the trend is higher. In other words, where data professionals come from is becoming more homogenous. With the increase in data science masters programs and incubators, I expect this trend to continue. Growth is not evenly experienced by each degree and we can look at changes within the top 10 backgrounds. Some are steadily gaining and some are rapidly loosing prominence.

Slide1Slide2

For those in Silicon Valley, this probably matches your on the ground experience. Originally, people already at companies stepped into data science roles on an as needed basis. Computer scientists and marketers were in common supply. Now that companies are hiring directly into data science, roles economists and statisticians are on the rise.

Okay, that’s where data professionals come from. Where do they go? We can perform a very similar analysis and arrive at the conclusions:

  • The top 10 industries have more than a quarter of data professionals, but still not a majority.
  • Over time, the top 10 are clearly loosing dominance.

Slide5

Top 10 industries for data professionals.

Slide6 Slide7

In short, where data professionals are hired is becoming increasingly diverse. Let us put these two trends together:

  • Homogenization of Sources of Data Professionals
  • Diversification of Industry Destinations of Data Professionals

Side by side, these trends seem at odds, with a potential down side. Consider a newly minted data scientist with a computer science background hired into an art conservation company. It’s possible their first year in the industry is spent using big data to confirm what conservationists already know from centuries of domain expertise. It would be a shame for such talent and resources to be spent re-inventing the wheel. A possible solution can be borrowed from Applied Math. My recommendation to the next generation of data scientists is learn your craft, learn your stats, learn your map-reduce, learn your visualizations. But for fun, couple your studies with classical courses from an application field you are interested in. After all, some of the happiest data scientists I know, use their skills to advance their passions in housing, movies, and fashion.

Women in the C-Suite: Ambitions and Likability

Women in the C-Suite: Ambitions and Likability

I love answering popular science questions! Recently, I was able to answer three of the juiciest career related questions I could think of with LinkedIn’s data. To put the cherry on top, LinkedIn and Strata were a tremendous help and made the work public here and here. Now, let me tell you the first of three data stories. It’s about the growth of women’s presence in executive leadership and how well liked executive leaders are.

C-Suites, or the group of chief executive officers (CEO), chief technical (CTO), COO, CIO, … are a powerful and fascinating crowd. While many stories of CEOs are about people who grew with the company from early stages, that is not typical. The C-Suite is not a group of people you pull off the shelf at the beginning stage of the company and who stay the same as the company grows. In fact, C-Suite growth is a function of company growth. There are two periods of growth, early stage and sustained growth. In the early growth stage, a company will have a CEO and may gain additional CXOs (people with chief department X officer titles), but is mostly focused on growing the employee base. Right around 3k employees the sustaining growth phase kicks in. For every additional 1k employees a company gains, the C-Suite will grow by an additional CXO.

executive_growth cxo_1

How the C-Suite grows has two interesting elements. For starters, large C-Suites actually have two CEOs, two CTOs, etc. This organization comes from mergers, acquisitions, and managing global companies. The second CEO’s title will be along the lines of CEO of Consumer Products, CEO of Asian Ventures, etc. The other cause of growth in the C-Suite is the X in CXO adopts many new meanings. Massive companies will most likely have a chief medical officer, chief learning officer, chief HR officer, etc. The diversity of titles of the C-Suite explodes for large companies. A question arises, as the diversity of C-Suite titles increases, how does the diversity of the C-Suite change?

women_cxo_proportion

Note: the outliers are from buckets of company size containing armed security organizations.

It’s gorgeous! Let’s take a moment to understand this plot. The larger the company, the higher the proportion of women in the C-Suite. Which means the growth rate of women in the C-Suite far exceeds the growth rate of the C-Suite! It may be increasingly difficult to obtain an executive position in a large company, but that’s where we approach gender equality. Okay, but is this because the roles such as chief administrative officer are bringing in women? Let’s look at only the CEO position:

Note: the outliers are from buckets of company size containing armed security organizations.

Note: the outliers are from buckets of company size containing armed security organizations.

The trend persists! I expect some learned colleagues can offer further insights and ask directive questions. I look forward to hearing and exploring them. In the meantime, my personal interpretation is:

If you are a woman aspiring to the C-Suite, dream big. Dream massive.

Right. Let’s say you get to the C-Suite. There is a famous study on a side effect by the Harvard Business School known as the Heidi/Howard paradigm. Women in managerial roles are perceived as equally competent and knowledgeable as men in similar roles, but not as well liked. Appeal can be tough to measure. To approximate how well liked a person is, let us use the number of endorsements they receive on LinkedIn. It’s not a precise measure of how well liked they are, but is close enough to give us insights into large trends.

 likeability_raw

It’s inline with expectations after the Heidi/Howard study. Men receive more endorsements in general. However, that’s not the complete picture. For small companies, women in the C-Suite receive more endorsements. In fact, women in the C-Suite at small companies receive the most endorsements. The implications are twofold. Heidi/Howard is not the complete picture. If the goal is to increase likeability, the benchmark should not be set between men and women, but between leaders at small and large companies.

likeability_benchmark

My goal is to add a positive perspective for what is possible. I hope some of this work is inspiring for both men and women. I do not hypothesize on the right and wrong compositions of a C-Suite; I think that is an intensely personal question for each and every company. As a somewhat ambitious woman at the very start of my career – these numbers make me smile.

Bounding Viral Impact in Experiments

Bounding Viral Impact in Experiments

Experimentation on social networks has a unique situation. Two connected members in different cohorts can influence what each other do. This social interference invalidates the accuracy of experimental results. For more details here is a nice talk explaining social interference by Johan Ugander and in technical detail see chapter 6. In short, the solution is to partition the network as much as possible and assign cohort treatments to the partitions. It’s a reasonable solution to a complex problem, but costly to implement in experimental systems. Even once implemented, cross experiment interference limits the number of experiments you can run simultaneously. Given these limitations, it’s handy to know when to invoke the Kraken solution. Fortunately, a simple 2 variable equation of the virality influence V and experimental impact can act as a guide. Virality is when one action triggers another, such as sending a message triggers the next person to send a message. Let p < 1 be the probability an action triggers another. Then the virality influence V is the expected total number of messages sent. In general for such actions as likes, comments, and shares V < 0.2. In short here are the variables:

V \approx \frac{1}{1 - p}

Cohort Actual Performance Observed Performance
A x z
B a · x c · z

By assuming all interference is across cohorts, we can bound the actual experimental impact a. The relation between observed to the actual performance is then:

z = \frac{(x + aVx)}{N}

c \cdot z = \frac{(ax + Vx)}{N}

With a small bit of algebra we find a beautiful bound:

a= \frac{c - V}{1 - cV}

So, why is it gorgeous? Let us consider the extrema.

  • In the ideal experiment V = 0 and the bound is a = c. Nice! Our bound is tight.
  • When all activity in cohort B is a byproduct of cohort Ac = V and the bound is a = 0. So in a dangerous system, a becomes scary.

In general the bound remains tight for low values of V and explodes with increasing social influence. Experimental Error from ViralityIn social networks, there are hundreds of features with V > 0. Fortunately, it’s easy to bound how much virality is impacting your results. If the impact is larger than a tolerable amount of error, then time to bring out the sledge hammer and split up your network. If it’s a tolerable amount of error, then march forward and conquer with your traditional a/b framework!  When in doubt. Gold:

a= \frac{c - V}{1 - cV}

. . . . Additional Examples with V = 0.04:

Cohort Actual Performance (T) Observed Performance (T) Actual Diff Bound
A x z
B a x 0.97 · z [-3.2%, -3%]
B’ a’ x 1.03 · z [+3%, +3.3%]

Experimental Impact with Virality

Unicorn or Data Monkey?

Unicorn or Data Monkey?

Data science is a position in tech blessed with the problem of asking “what should I do today?” Even if you have what appears as a directive — for instance “analyze this experiment’s impact under the global metrics” — you still have the prerogative to determine the level of detail the analysis requires. Should you simulate the projected lift from personalizing the experiment? Should you pull additional metrics? Should you understand why this experiment moved metrics and suggest additional experiments?

In short, the choice of what to do includes:

  • Pull top tier metric impact (daily duty of a Data Monkey)
  • Decide which additional metrics should be pulled
  • Simulate customizing treatment based on demographics
  • Understand why this experiment moved metrics and suggest followup (signature of a Unicorn – a person with the 30 skills listed at the bottom of a data science job description)

An unconscious choice is now made. The analyst immediately filters the options to what their own skills are capable of. If they have a mathematical reasoning limit, they will not think there are additional pertinent metrics. If they can not write the hadoop necessary to pull member demographics, they will not think to customize the experiment. Now for the tricky one: If they are not a unicorn, they will not ask why, have the je ne sais quoi to discover why, and ultimately propose additional wins!

Now for a given experiment, the difference between a data monkey and a unicorn, may not be that large. Even over the course of a dozen experiments the relative gain on moving company metrics may only be 10%. But, every now and then, the decision to be made is the choice between two possible products that will determine the course of the company. I leave to the imagination the differences in company success when the analysis of which product directions to develop is done by a data monkey or unicorn.

The silver lining is twofold: with experience you can discern which projects warrant unicorns or data monkeys and unicorns are made, not born.